

Dear investors,
Most people chase stocks. Pros watch bonds.
And right now, the bond market is flashing red signals…
Every investor should pay attention.
The US 10-year Treasury yield has been above 4% for the longest sustained stretch since before the 2008 financial crisis.
And yet most retail investors are still obsessing over P/E ratios and earnings beats.
That’s the wrong game.
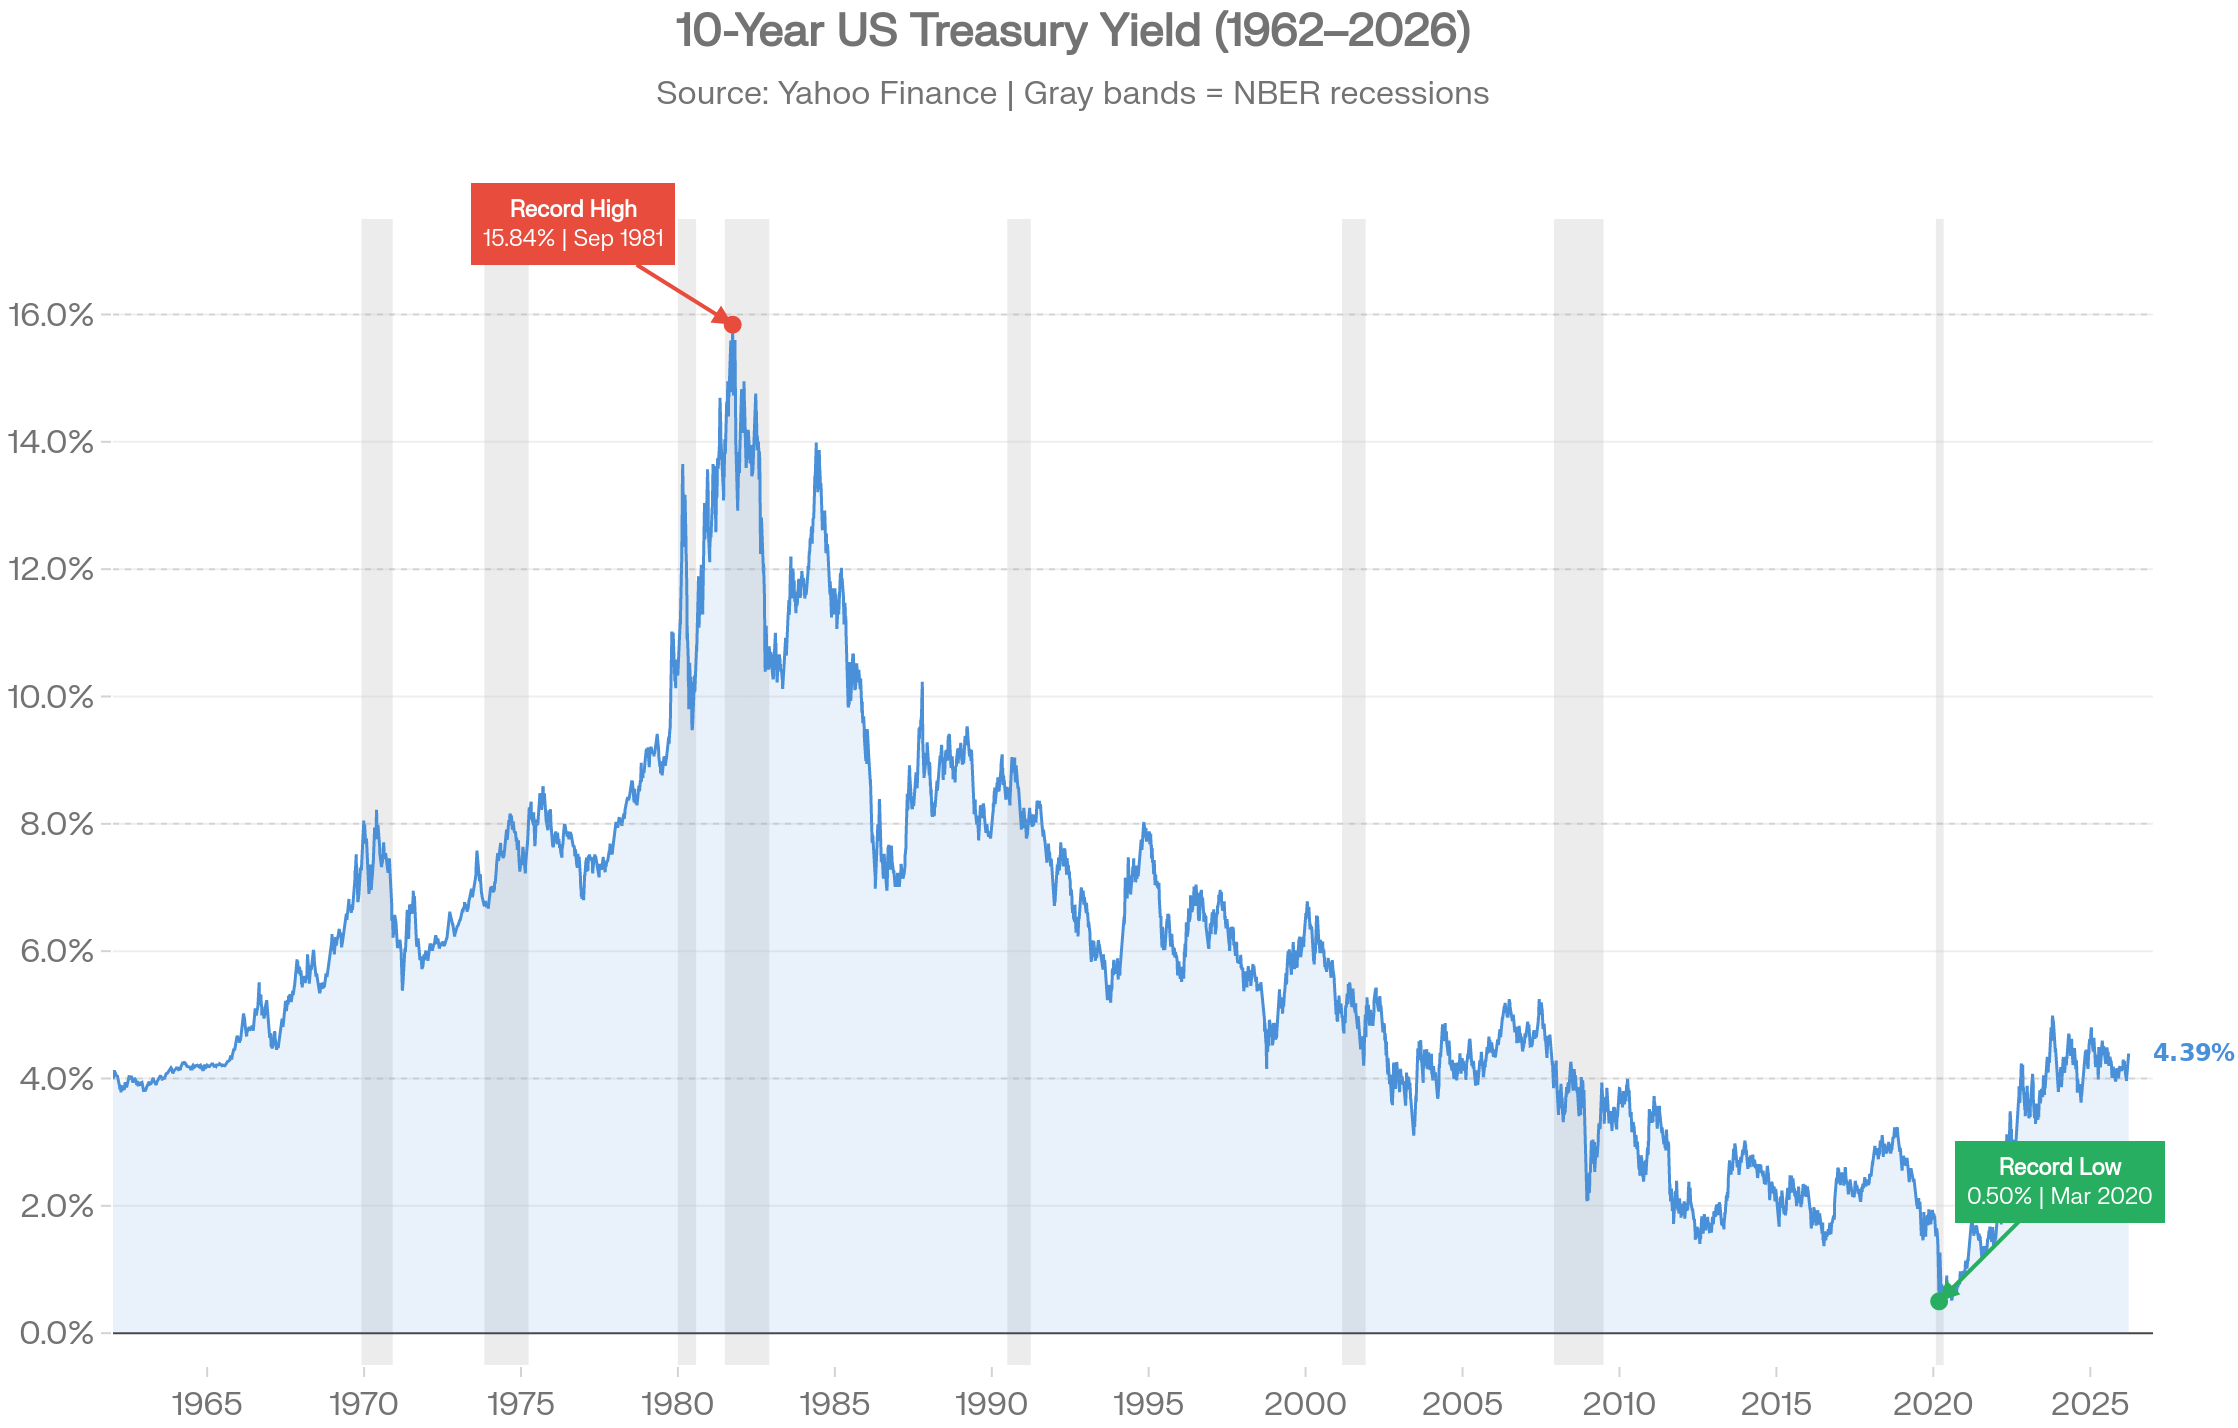
The bond market is the operating system our economy.
When it moves, everything moves — stocks, real estate, gold, crypto.
All of it.
Understanding bonds isn’t optional for serious investors.
It’s the single highest-leverage upgrade you can make to your entire investment worldview. This is the explainer I wish I had.
The U.S. Treasury collapse is HERE!
Foreign buyers are gone. Interest costs just hit $1.21 TRILLION. Central banks are dumping dollars and hoarding gold at the fastest pace in history.
Ray Dalio calls it an “economic heart attack.”
25,000+ readers already repositioned with the exact 3 crisis-proof portfolios that thrive when bonds break and the dollar cracks.
Get the complete 2026 Protection Playbook — full portfolio allocations, rebalancing triggers, and real-time alerts — before the next leg down hits.
What a Bond Actually Is?
Let’s make this simple. A bond is a loan. You are the lender.
But first here’s what should hit you:
The global bond market is valued at approximately $318 trillion.
The global stock market? $135 trillion.

The market that most retail investors completely ignore is 2 times larger than the one they obsess over daily.
It controls the cost of borrowing for every government, every company, and every consumer on Earth.
It shapes every central bank decision.
It sets the mathematical floor for every stock valuation model ever built.
Ray Dalio calls the current US Treasury situation an “economic heart attack.”
Warren Buffett is sitting on a record $381+ billion in cash — the largest cash position in Berkshire’s 60-year history. He has been a net seller of equities for multiple consecutive quarters.
This isn’t coincidence.
These are people who understand what the bond market is saying.
Why IT Controls Your Stocks?
When you buy a US Treasury, you are lending money to the US government.
They promise to pay you back the full amount — plus fixed interest along the way — at a predetermined date.
That’s it. No ownership. No upside surprise.
Contractual cash flows and a maturity date.
Stocks work completely differently. You buy ownership. You get variable dividends and whatever other investors are willing to pay for your shares.
No guarantees. No contract. Just exposure to growth — or collapse.
Here’s the single most important mechanic in all of finance:
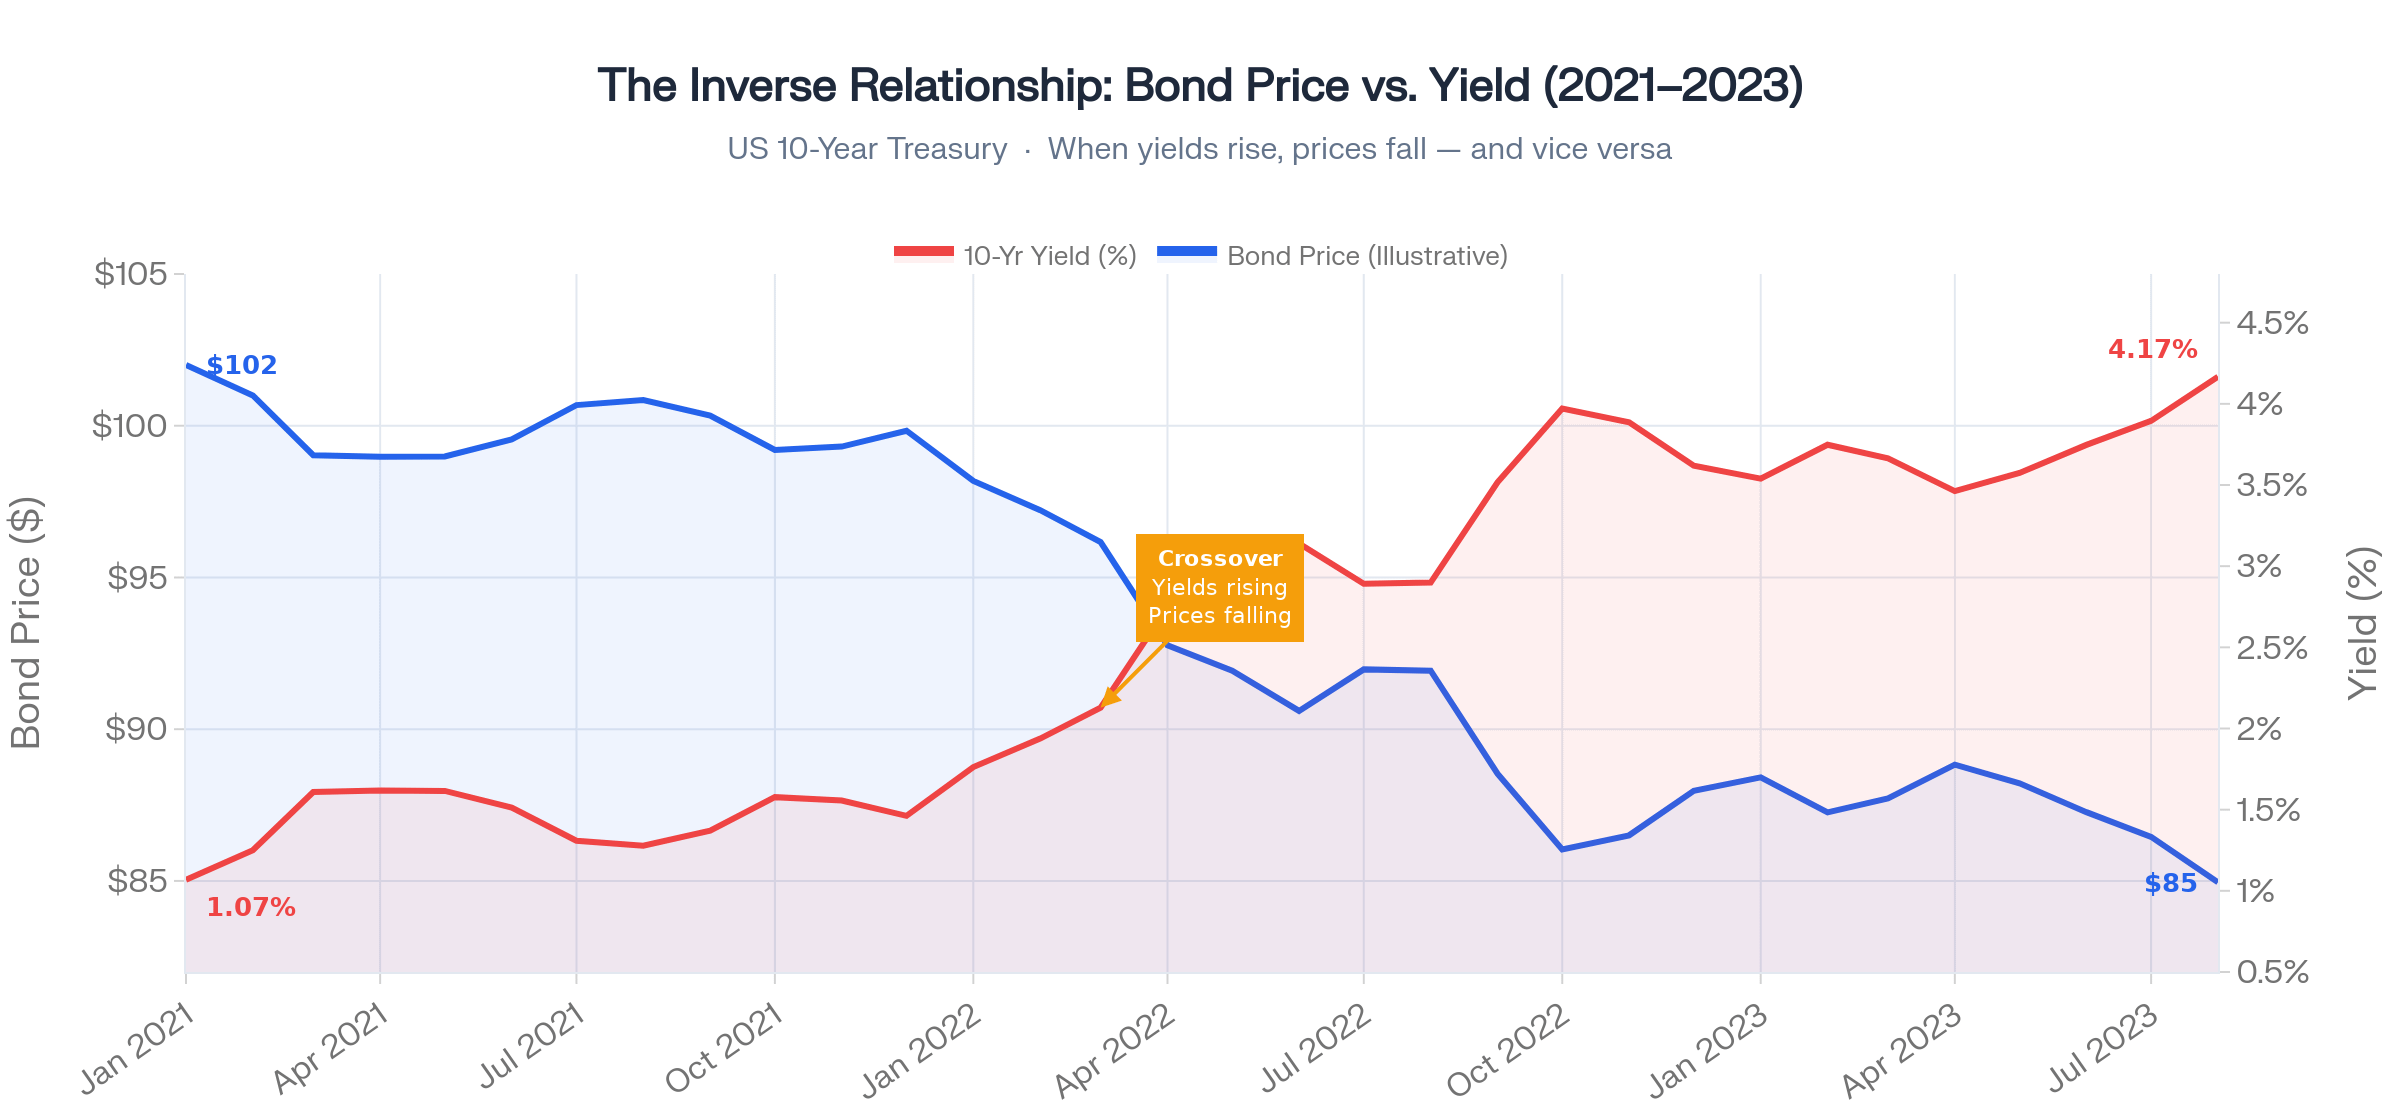
“Bond prices and yields move in opposite directions.”
When investors rush to buy bonds, prices go up — and yields automatically fall.
When investors sell bonds, prices drop — and yields rise.
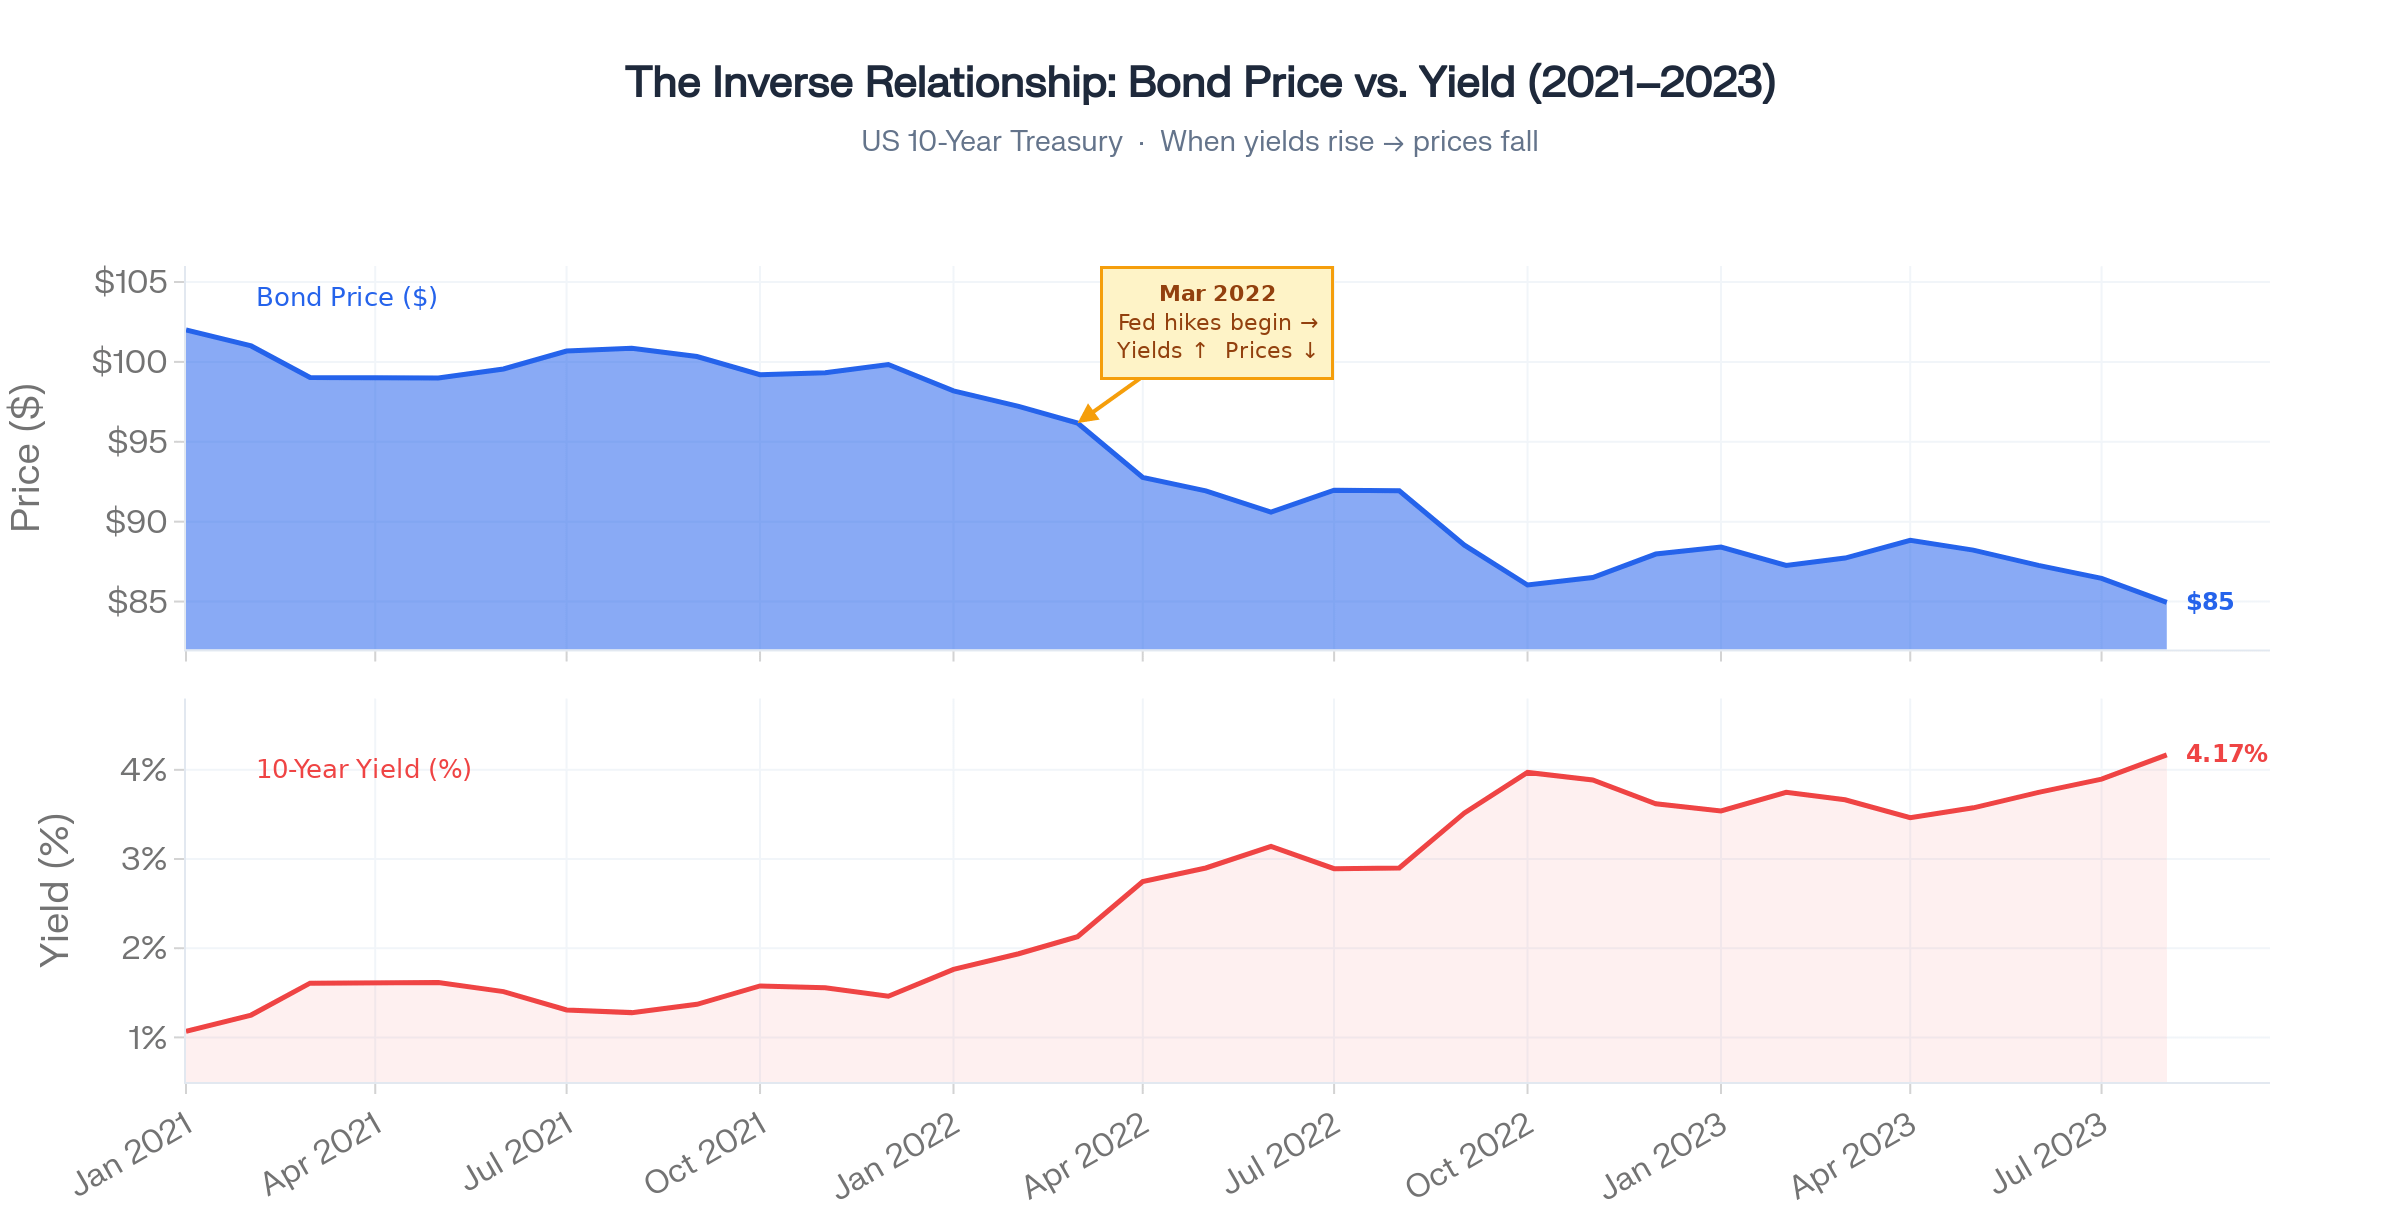
This inverse relationship drives an enormous amount of market behavior that looks confusing until you see it through this lens.
The 2022 bear market?
The Nasdaq fell 33%. Growth stocks lost 50–80%. Most people blamed “tech valuations” or “the economy.”
The real driver: 10-year Treasury yields went from 1.5% to nearly 5%.
The discount rate used in every stock valuation model exploded — and so did the math that justified sky-high prices.
That’s not a tech story. That’s a bond story.
Bond Market Nobody Taught You About
Bonds aren’t one thing. They’re an entire spectrum:
US Treasuries — T-Bills (short-term), T-Notes (2–10 year), T-Bonds (30 year). Issued by the federal government. The global benchmark for “risk-free” rates. Every other asset on Earth is priced relative to these.
Agency Bonds — Issued by Fannie Mae, Freddie Mac, and similar entities. Slightly higher yield. Still government-backed.
Municipal Bonds (Munis) — Issued by states and cities. Often tax-advantaged. Massive market for US investors.
Investment-Grade Corporate Bonds — Apple, Microsoft, Johnson & Johnson borrowing at modest spreads above Treasuries.
High-Yield (Junk) Bonds — Lower-rated companies paying significantly higher yields to compensate for real default risk.
TIPS (Treasury Inflation-Protected Securities) — Principal adjusts with CPI. The purest measure of real yield in the market — and one of the most important signals for gold pricing.
The risk-yield hierarchy is intuitive: safest instruments offer the lowest yields, riskiest corporate bonds offer the highest.
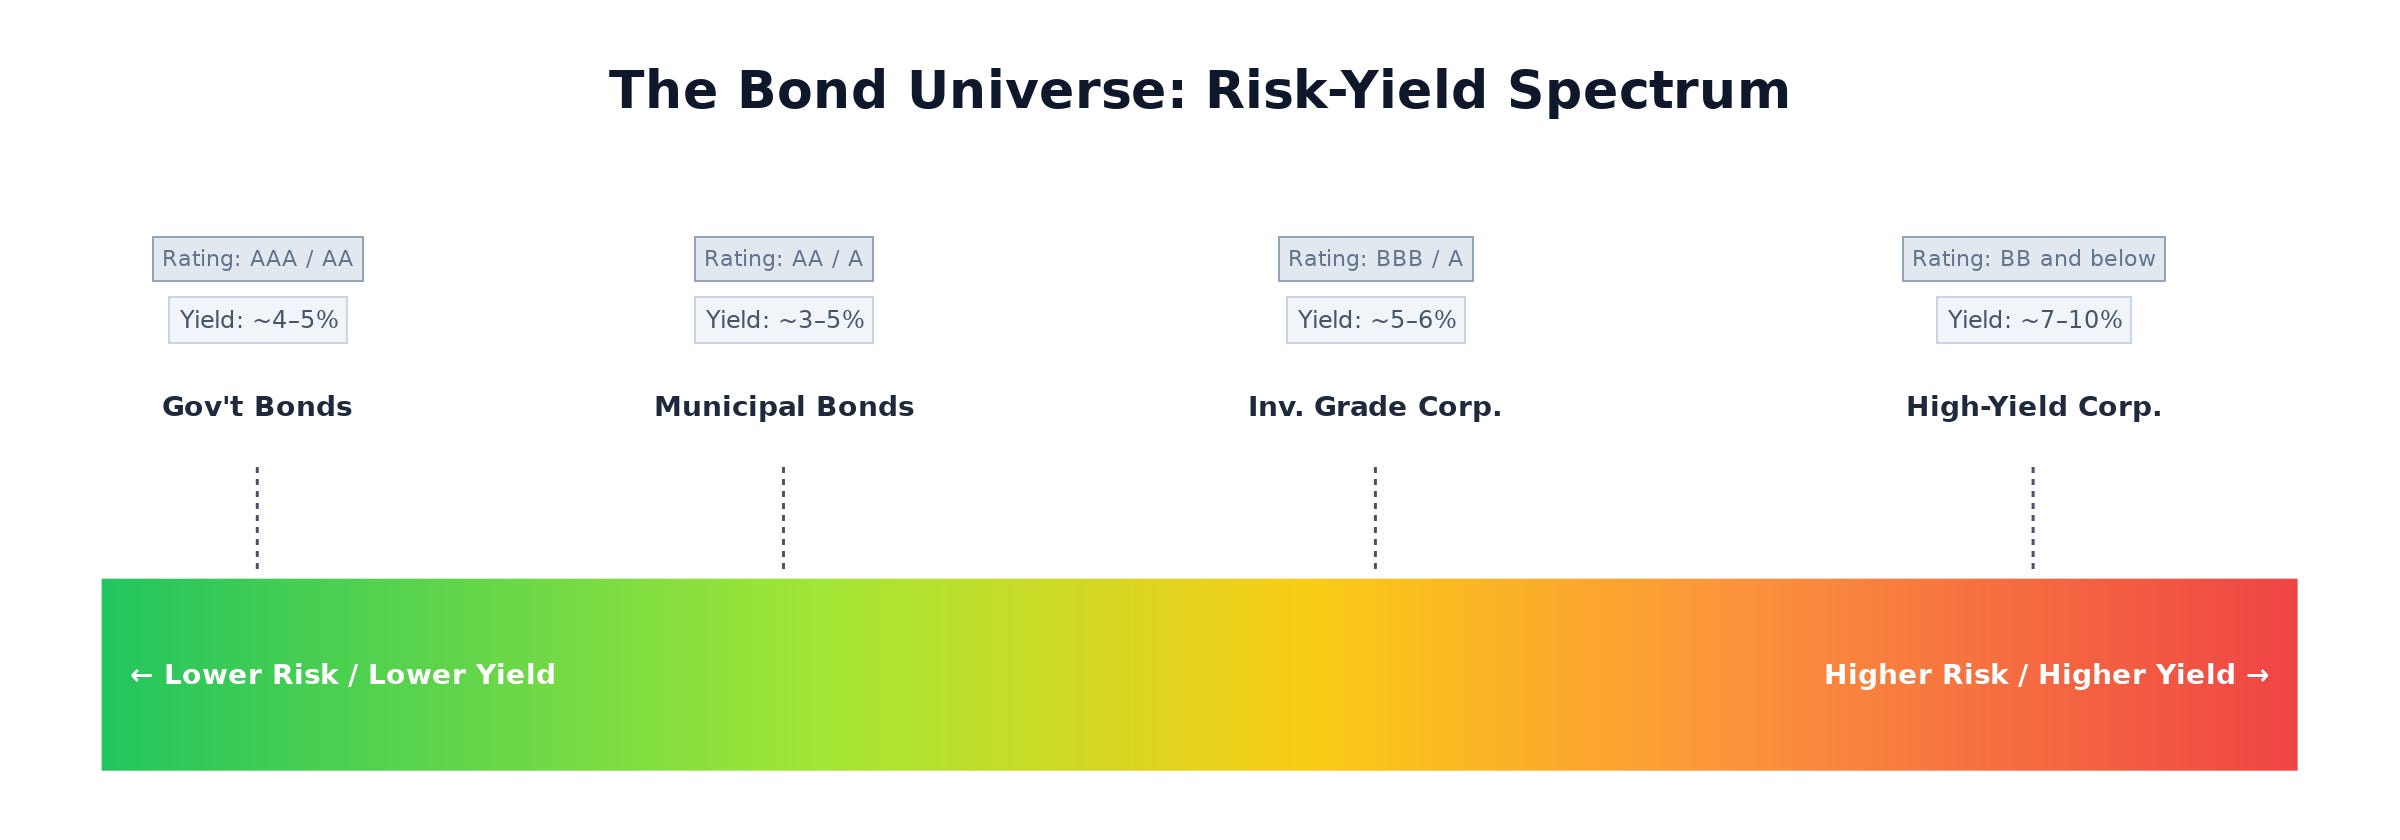
Capital flows up and down this spectrum constantly based on macro conditions.
When you see capital “rotating to safety,” this is exactly what’s happening — money moving from the bottom of this stack toward the top.
Yield Curve: Economy’s Crystal Ball
This is where it gets genuinely powerful.
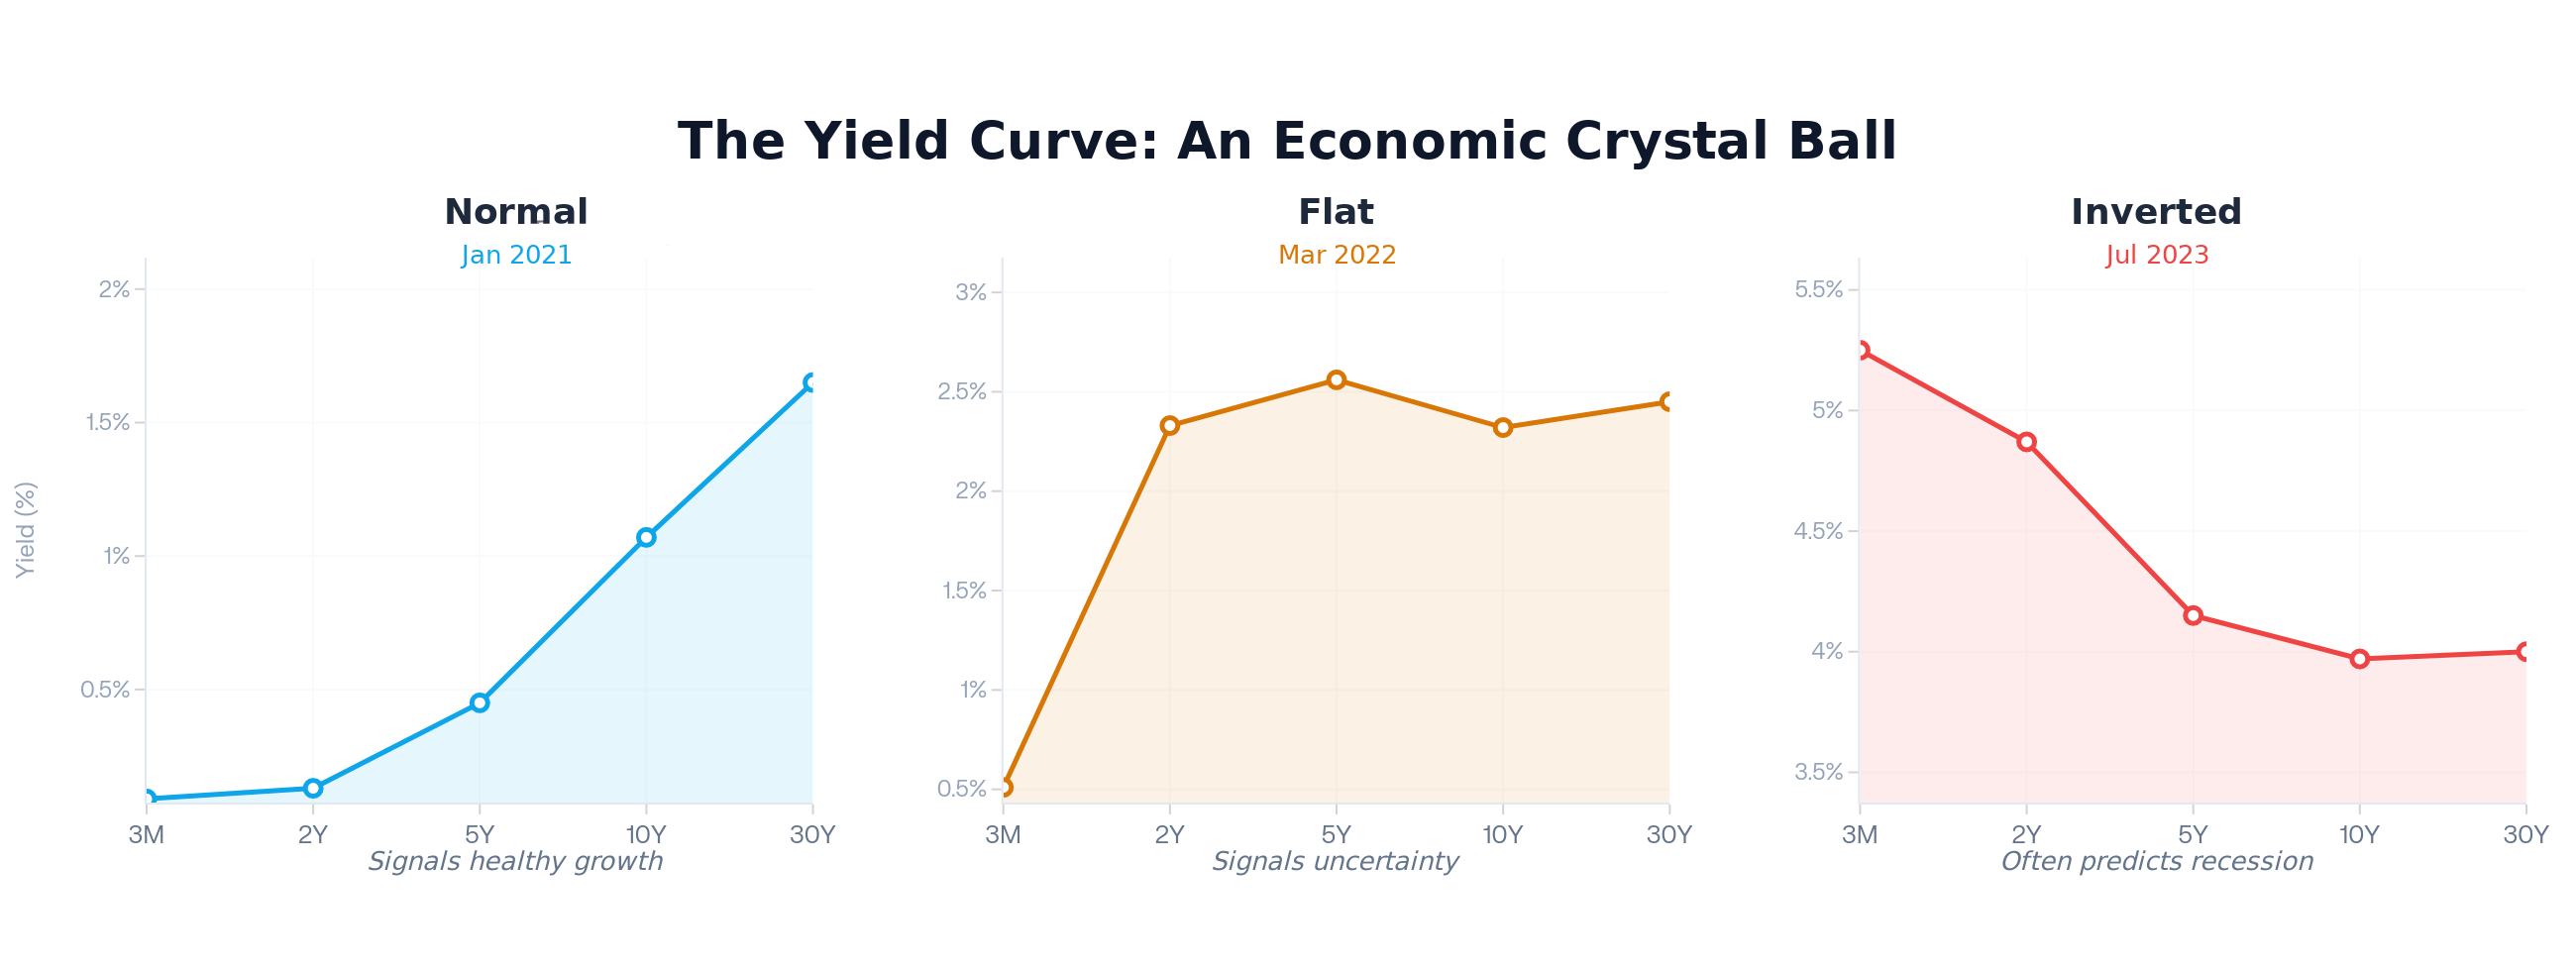
Plot US Treasury yields across different maturities — 3-month, 2-year, 5-year, 10-year, 30-year — on a chart.
That line is called the yield curve.
It reveals what the most sophisticated, best-capitalized investors on the planet collectively believe about the economic future.
Three shapes matter:
Normal Curve → Healthy growth
Long-term rates are higher than short-term rates. Investors demand more compensation for lending money for longer periods. Economy is expected to grow.Flat Curve → Uncertainty
Short and long-term rates are roughly equal. Transition zone. Often a warning.Inverted Curve → Danger
Short-term rates exceed long-term rates. This means the market expects the Fed to cut rates sharply in the future — which only happens when the economy weakens badly enough to force their hand.
Here’s the data point that should keep you up at night:
The 2-year/10-year Treasury spread has inverted before every single major US recession since the 1970s.
Not most. Every one.
It inverted before 2001. Before 2008. Before 2020.
The stock market typically peaks near the inversion — then enters a bear market as the recession materializes months later.
This is why bond traders are essentially professional economic forecasters. Their collective buying and selling across maturities creates a predictive signal more reliable than any analyst on CNBC.
Give this prompt to your favorite AI:
Plot US Treasury yields across different maturities — 3-month, 2-year, 5-year, 10-year, 30-year — on a chart.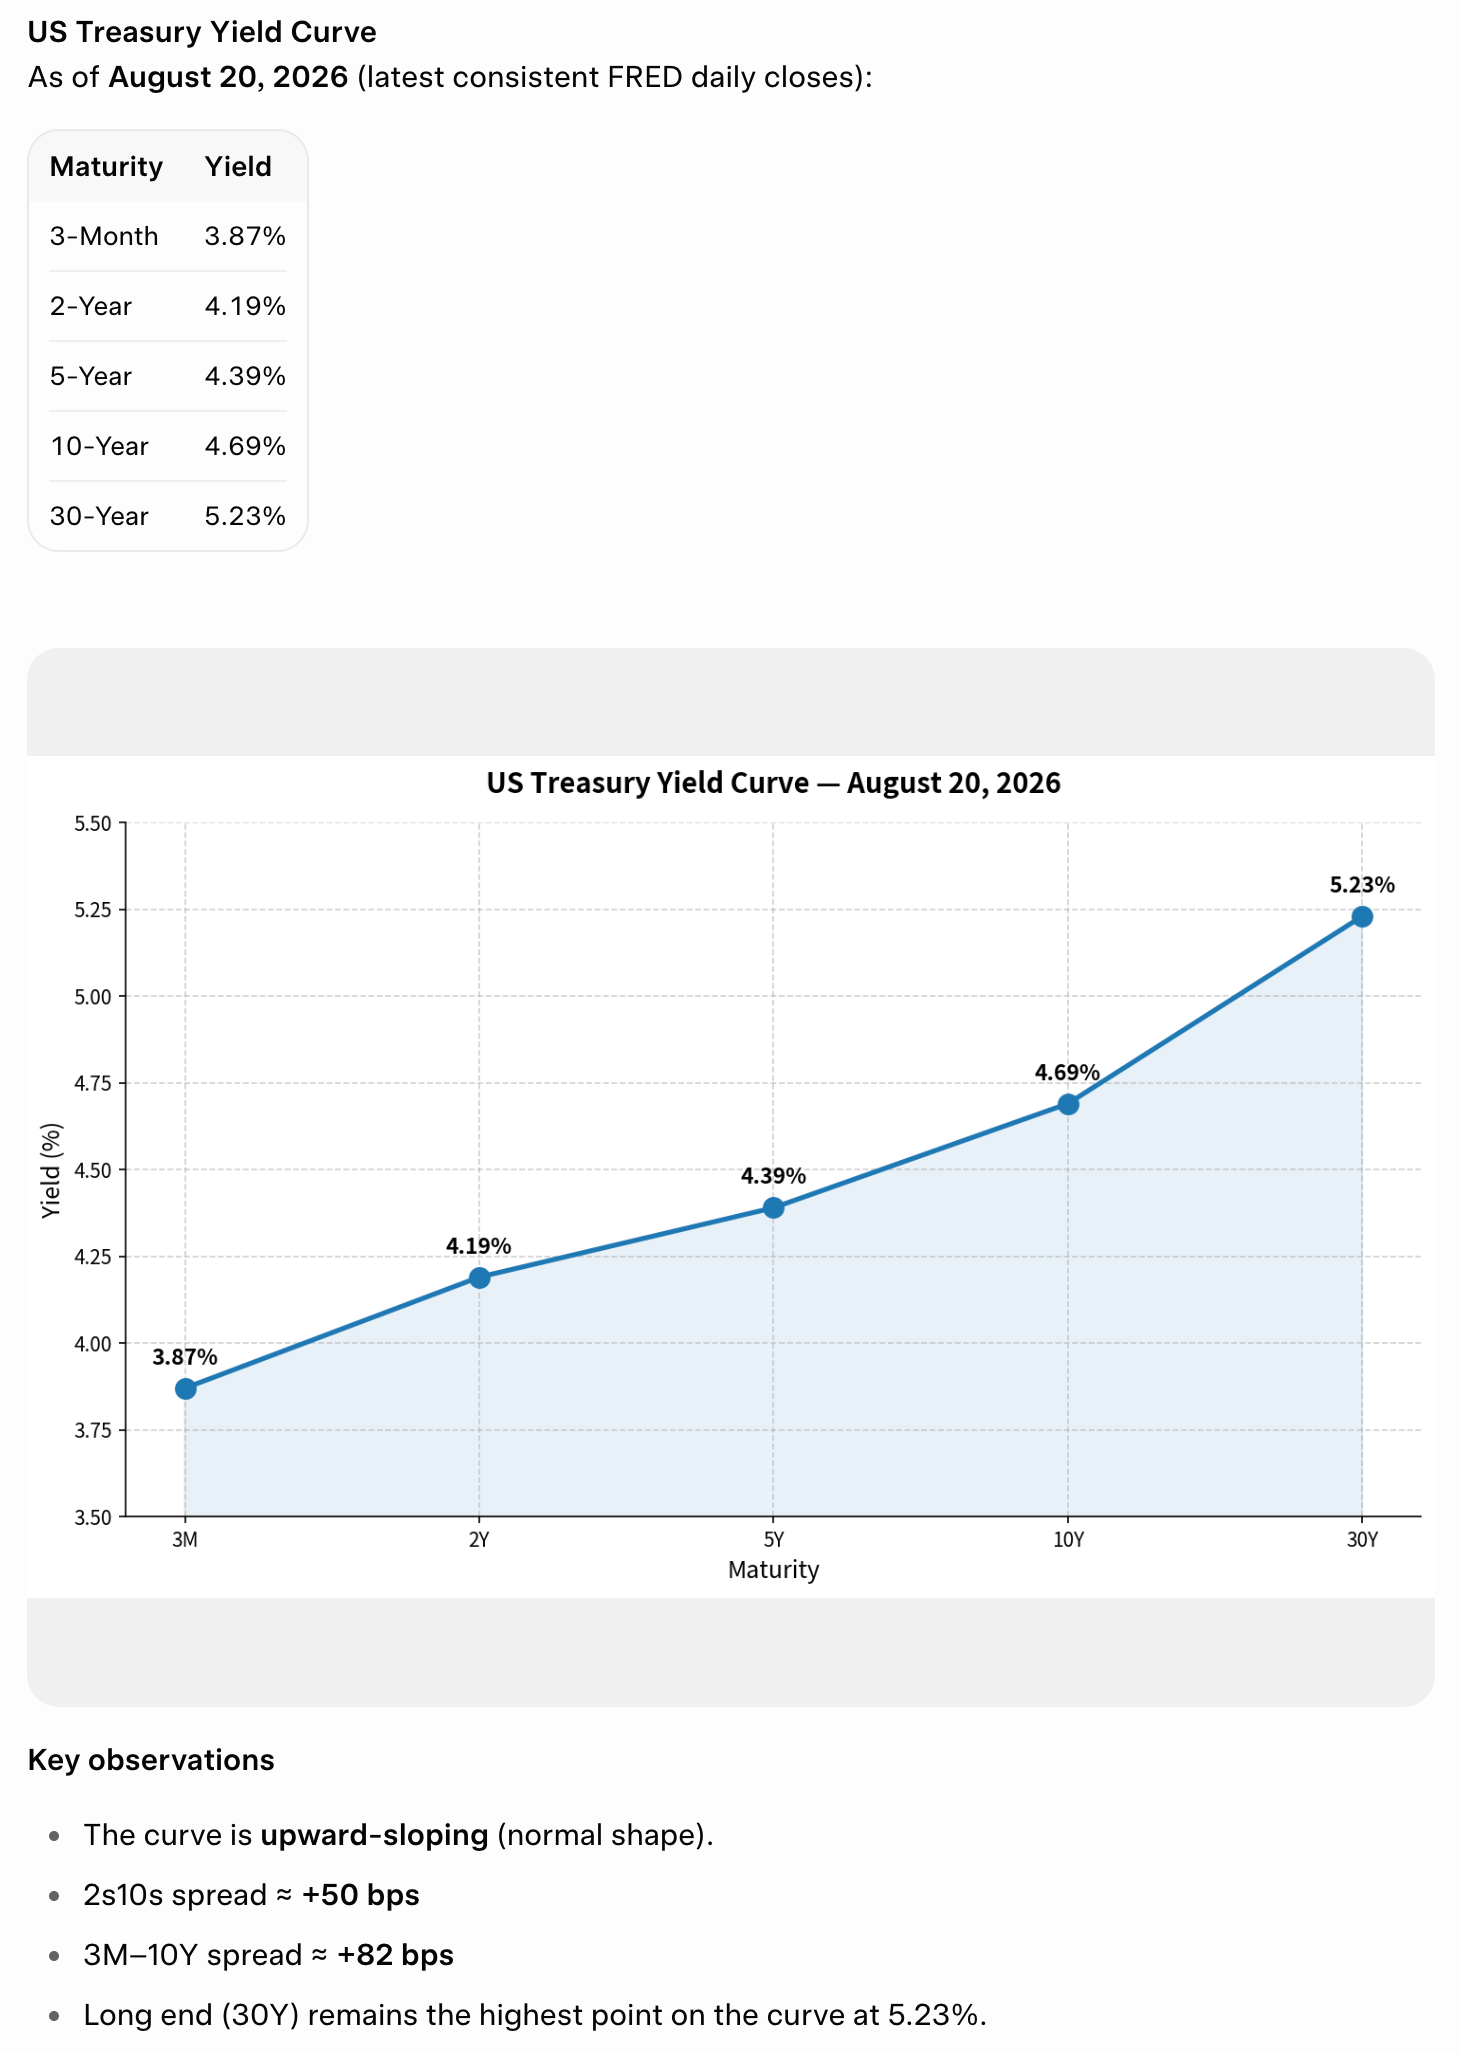
How the Fed Actually Moves Markets
The Federal Reserve doesn’t directly control your mortgage rate, your corporate bond rate, or the discount rate your stock gets valued at.
It controls the overnight lending rate — and then influences everything else through the bond market.
Here’s the full transmission mechanism:
Open Market Operations
The Fed buys and sells Treasuries to inject or drain liquidity from the banking system. This is ongoing, every week.Quantitative Easing (QE)
Large-scale Treasury and mortgage bond purchases designed to push down long-term yields when short rates approach zero. The Fed’s balance sheet went from $800 billion pre-2008 to over $9 trillion at peak. Every dollar of QE was designed to hold bond yields down — which is why stock valuations exploded at that era.Quantitative Tightening (QT)
The reverse. Fed lets bonds mature without reinvestment, shrinking its balance sheet. This pushes yields higher. The 2022–2023 QT cycle was the most aggressive in history — and it triggered the sharpest valuation compression in a generation.Forward Guidance
The words Fed officials use move the entire yield curve before a single bond is traded. Markets are pricing future rate paths in real time.
When the Fed speaks, bond markets move first. Stock markets respond to what bond markets just did. Understanding this sequence explains why equity markets react to Fed meetings instantly — because the math behind every stock valuation just changed.
Join 18,000+ Investors Using the 80/20 Rule to Build Smarter, Higher-Returning Portfolios
The Pareto Investor delivers a proven, systematic framework to apply the 80/20 rule to stocks — focusing only on the tiny fraction of companies that drive nearly all market gains.
Membership Tiers for 2026:
Premium — Everything you need to outperform the market with less effort:
Full access to all live Pareto portfolios (Alpha, Permanent & Momentum)
Monthly portfolio updates with exact stock selections
Rebalancing alerts & detailed review framework
Exclusive investment insights & advanced portfolio optimizations
Elite — Everything in Premium & permanent ownership of my most powerful tools:
Pareto Elite Sheet — Fully automated annual rebalancing, real-time portfolio dashboard, and live tracking.
50+ Years of Historical Stock Data.
Pareto Watchlist & AI Stock Screener.
EXCLUSIVE Ultra Alpha Portfolio — Immediate, exclusive access to my highest-conviction wealth-creation framework. Available only to Elite members.
Only 4% of stocks account for nearly all net wealth creation in the market. Why settle for mediocre index returns held back by thousands of underperformers? Join 18K+ investors focusing only on the rare winners — and upgrade your returns with the Pareto Principle today.
US Fiscal Crisis Is a Bond Story
This is the layer that most stock investors are completely missing right now.
When the US government runs a $2 trillion annual deficit, it must sell $2 trillion in new Treasury bonds to fund it. Basic supply and demand: more bonds entering the market means the government must offer higher yields to attract enough buyers.
The numbers are staggering:
US federal debt: $36+ trillion and adding roughly $1 trillion every 75 days
Annual interest cost: $1.21 trillion — now the single largest line item in the federal budget, surpassing defense
CBO projections: $59 trillion by 2035, $100 trillion by 2048
Foreign central banks — historically the largest buyers of US Treasuries — are reducing their holdings at the fastest pace in decades.
China, Japan, and Middle Eastern sovereign wealth funds are diversifying away from dollar-denominated bonds.
This means the US Treasury must increasingly sell to domestic buyers at higher yields to clear the market.
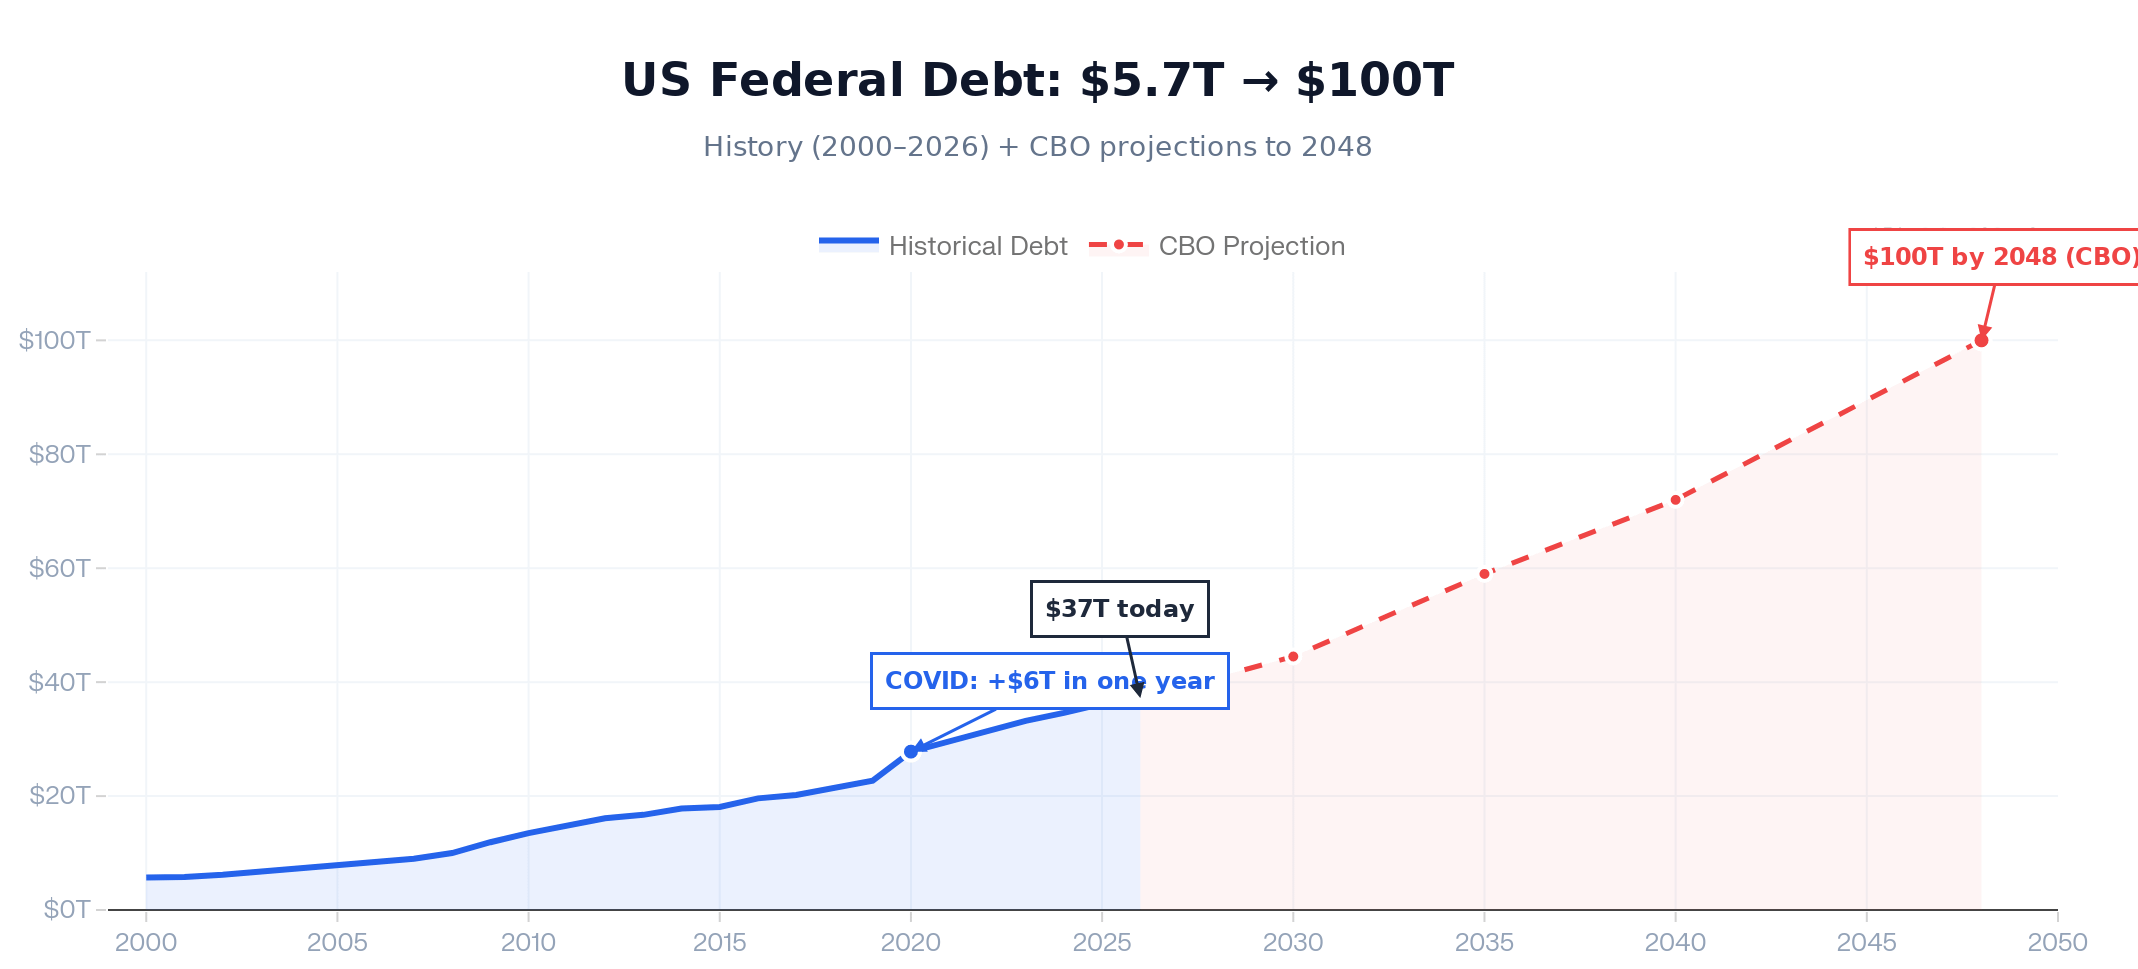
Higher Treasury yields cascade through the entire economy: mortgage rates rise, corporate borrowing costs rise, discount rates for stock valuations rise.
This is the direct transmission from Washington’s spending decisions to your portfolio performance.
Stock markets hate fiscal instability not for abstract reasons — but because more government debt supply forces yields higher, which mathematically compresses the valuations of every equity you own.
A Magic Formula Connecting Bonds and Stocks
This is where theory meets your actual portfolio. The Fed Model compares the stock market’s earnings yield (earnings per share ÷ stock price, or 1/PE ratio) against the Treasury yield.
When 10-year Treasuries yield 1.5%, a stock market trading at 30× earnings (3.3% earnings yield) makes sense — you’re getting a 1.8% risk premium over a guaranteed return.
When Treasuries yield 5%, that same 30× PE market is actually offering less return than risk-free bonds — with infinitely more volatility.
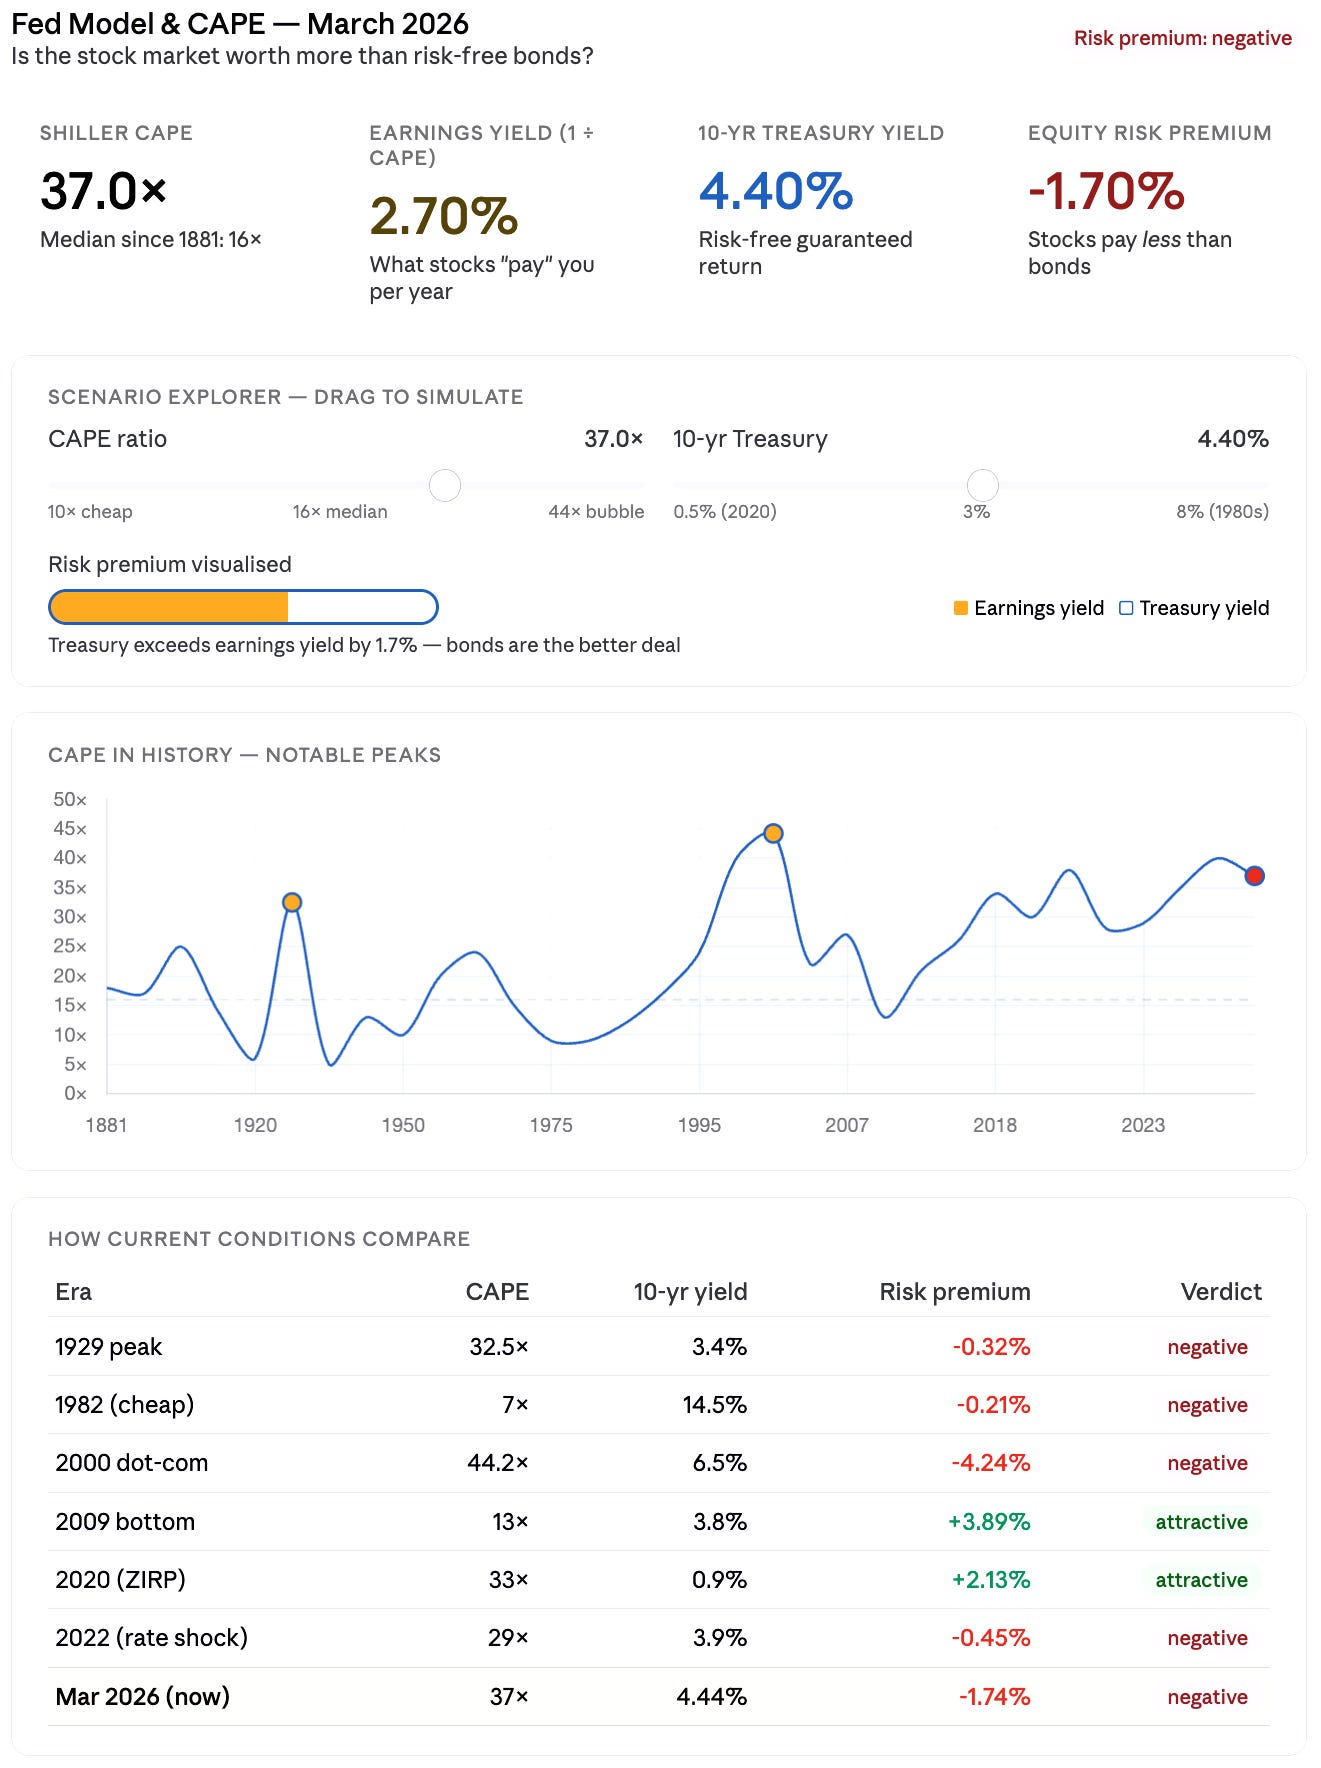
The Shiller CAPE ratio currently sits at approximately 37–39× as of early 2026.
That’s only been exceeded twice in 145 years of data: before the 1929 crash and briefly before the dot-com peak in 2000.
Meanwhile, 10-year Treasuries are yielding 4.4%+.
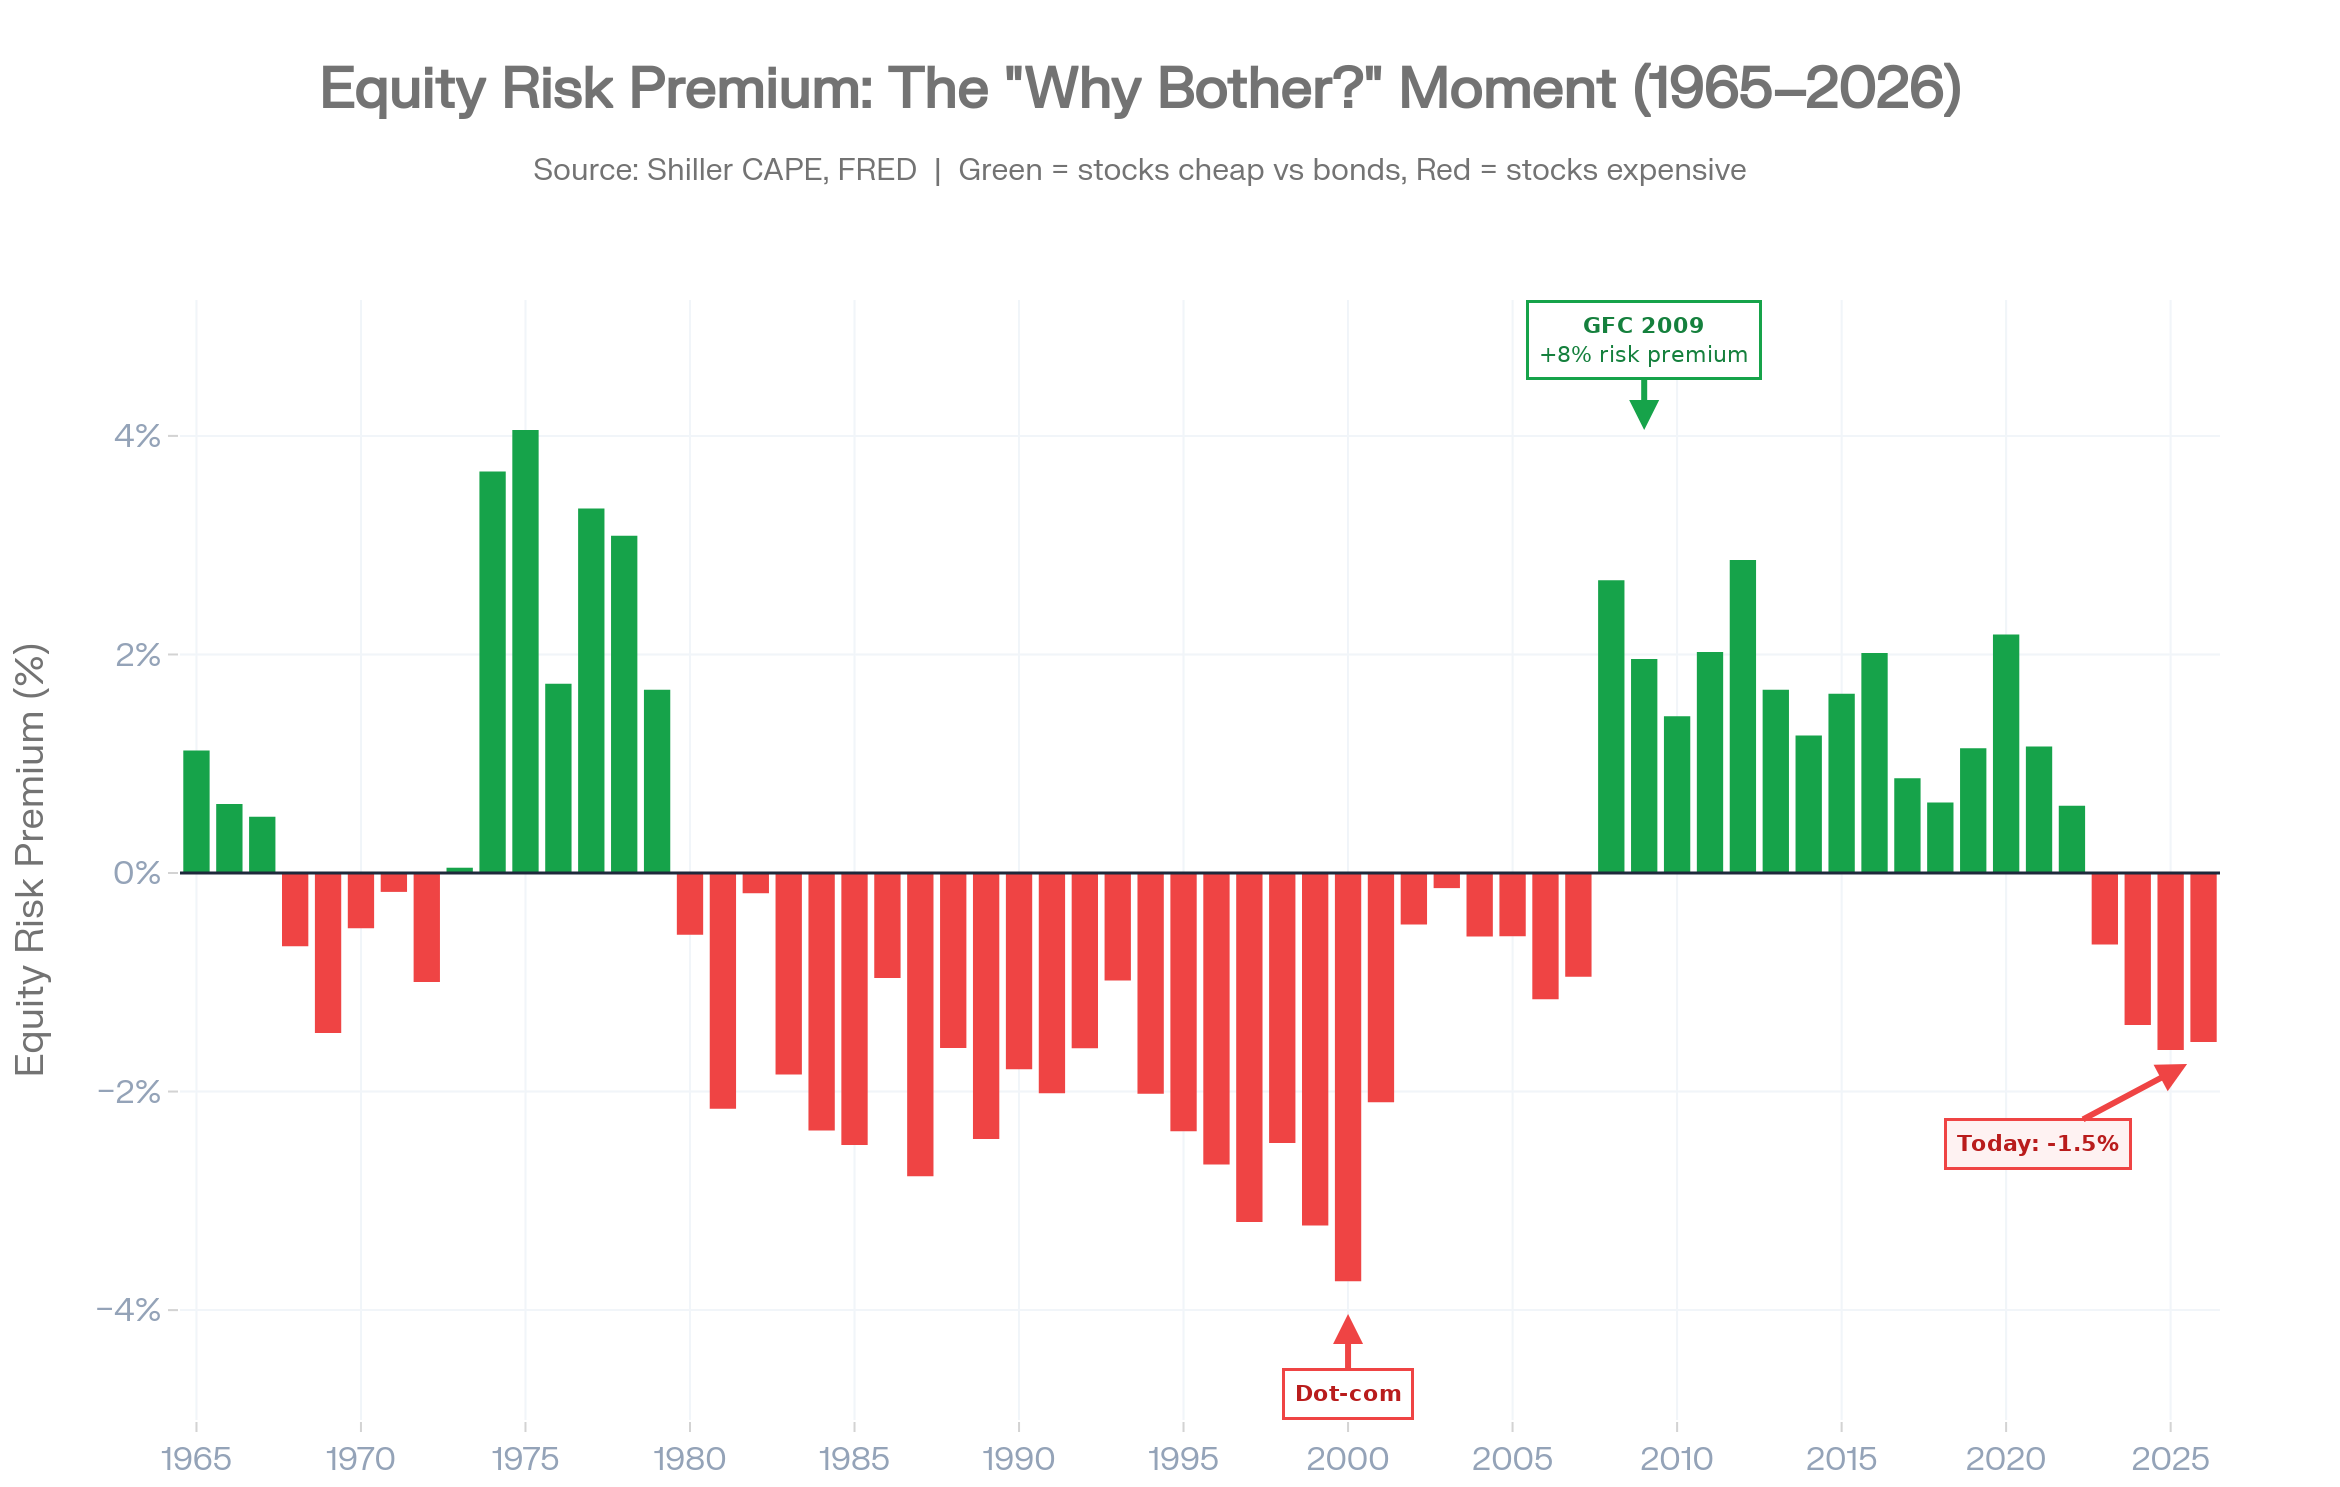
The model rests on a simple idea: stocks and bonds are competing for the same capital. A stock trading at 37× earnings has an “earnings yield” of 1/37 = 2.7% — that’s what the market is implicitly promising you in annual return per dollar invested.
The 10-year Treasury currently sits around 4.44%, guaranteed, with no volatility.
The equity risk premium — the extra return stocks offer above that safe alternative — is therefore roughly −1.74%.
You’re paying for the privilege of taking on far more risk and getting less return.
That’s the signal the Fed Model is sending.
Why the CAPE matters more than the trailing PE?
A regular PE ratio is noisy — it swings wildly with recessions and earnings spikes.
The Shiller CAPE smooths earnings over a 10-year inflation-adjusted window, removing those cycles.
The historical median since 1881 is about 16×, and the current reading sits above 36.
Today’s market is trading at over 130% above that historical average — a level only surpassed during the height of the dot-com bubble in 2000, when the ratio peaked at 44.19.
The two times it’s been here before
The 1929 peak reached about 32.5× — lower than today — before the crash that followed. The 2000 dot-com peak hit 44× at its extreme.
The CAPE closed 2025 just above 40, making this only the second time in the market’s history that the gauge has surpassed 40.
The difference from 2000 worth noting: today’s mega-cap companies are fundamentally different from earlier index constituents, AI remains a powerful secular trend, and the infrastructure supporting it could sustain elevated growth.
That’s the bear case against the model being a perfect alarm bell.
What the interaction of high CAPE + high yields means?
In 2020–2021, the CAPE was elevated (30–38×) but 10-year Treasuries yielded under 1%. That gave stocks a positive risk premium of 2–3% even at stretched valuations — there was a credible argument for staying in equities.
Now both variables are working against equities simultaneously: CAPE is historically extreme and the risk-free alternative pays 4.4%.
When the dot-com bubble burst, the subsequent normalization resulted in a nearly 50% drop in the S&P 500 and a lost decade for equity returns.
Warning Signal Professionals Actually Use
This early warning signal that professionals use is the credit spread.
A credit spread is the extra yield a corporate bond pays above a comparable Treasury. Treasuries are the baseline — they carry no default risk because the US government can print dollars. A company can’t.
So when you lend to a corporation, you demand compensation for the possibility they don’t pay you back. That compensation is the spread. A BBB-rated company borrowing for 10 years might issue a bond at Treasury + 1.3% — those 130 basis points are the spread.

What makes spreads uniquely powerful as a fear gauge is how they’re set.
They reprice continuously, in real time, based on what thousands of professional credit investors collectively believe about default probability.
Those investors are structurally more conservative than equity investors — they’re first in line to get paid in a bankruptcy, which means they start getting nervous before stock markets do.
Historically, spreads widen 3–6 months before recessions show up in GDP data.
They’re a leading indicator, not a lagging one.
Rising breakeven inflation rates — the difference between regular Treasury yields and TIPS yields — signal the dangerous inflation regime where bonds don’t protect you.
Widening credit spreads signal the risk-off regime where Treasuries become your best friend. These two readings together tell you more about what the market actually believes than any earnings report or economic forecast.
Right now, that reading is unusual.
The average option-adjusted spread on the Bloomberg US Corporate High-Yield Bond Index sits at roughly 2.7%, well below its 20-year average of 4.9%.
Investment-grade spreads are similarly compressed.
The bond market is pricing in near-zero defaults — which is striking given that the risk-free rate sits at 4.4% and the Shiller CAPE is near 37×.
All three signals are simultaneously flashing complacency.
None of them independently guarantees a correction, but when they align like this, the asymmetry of outcomes skews hard to the downside.
This matters directly for energy and commodity positions.
When a spread-widening cycle is driven by recession fears, energy names get hit twice: through the equity channel as earnings expectations fall, and through the credit channel as refinancing costs rise for leveraged operators.
Spread compression today is masking that vulnerability, not eliminating it.
Three Scenarios, One Framework
This is a practical “scenario playbook” for investors. It’s built around one big idea: bond yields (interest rates) drive everything else in markets.
Depending on whether rates stay stable, shoot higher, or crash lower, different parts of your portfolio win or lose — and by a lot.
Nobody can tell the exact date of current regime shifts.
However, this framework gives you is something more useful than a prediction — it gives you informed positioning across the three realistic outcomes, so that when the shift comes, you’re already in the right place rather than scrambling to react.
Rates stabilize, soft landing materializes
What happens in the economy: Inflation cools just enough, the Fed doesn’t have to hike anymore, and growth stays decent. No big recession, no runaway inflation.What happens to bond yields: The 10-year Treasury yield stays roughly where it is today (around 4.3–4.7%). It doesn’t move much.
What happens to stocks:
High-multiple growth stocks (think big tech with sky-high P/E ratios) get a little cheaper because investors compare them to the “safe” yield on Treasuries. If Treasuries yield 4.5%, a stock with a 3% earnings yield suddenly doesn’t look as attractive.
Dividend-paying value stocks (banks, energy, consumer staples, utilities) do better. They give you 4–6% dividends right now, so they compete very well with bonds.
Bottom line for you: You don’t make a killing, but you also don’t get crushed. The key skill is not chasing the expensive growth names and instead owning the boring, high-dividend value sectors. Multiples compress a bit, but no crash.
Fiscal pressure forces yields higher
What causes it: The U.S. government keeps issuing tons of new Treasury bonds to fund deficits + inflation stays stickier than expected. Bond buyers demand higher yields to compensate.What happens to bond yields: 10-year Treasury yield jumps above 5.5% (maybe even 6%).
What happens to stocks:
Growth stocks get hammered (down 25–35%). Why? Simple math: higher discount rates make future cash flows worth a lot less today. A stock that was valued on earnings 10 years from now suddenly looks way overpriced.
Credit spreads widen → borrowing gets more expensive for companies, especially weaker ones.
What wins instead:
Value stocks (cheap, profitable, often energy/mining/industrials)
Commodities (oil, copper, etc.)
Short-duration assets (cash, money-market funds, short-term bonds) — they don’t lose value when rates rise.
Bottom line for you: This is the regime where understanding bonds saves your portfolio. If you’re heavy in high-growth tech, you can have a genuinely bad year. If you rotate into value + commodities early, you can actually make money while the rest of the market bleeds.
Recession triggers a flight to quality
What causes it: Economy slows hard, corporate earnings disappoint, unemployment rises.What happens to bond yields: Fed cuts rates aggressively → Treasury yields collapse (10-year could drop to 3% or lower).
What happens to stocks: Market falls 30–40% first (normal recession behavior), then recovers once the Fed starts pumping stimulus.
What wins big:
Long-duration Treasuries (especially 10- or 30-year bonds) — their prices soar when yields fall.
Gold (real yields drop → gold becomes more attractive).
Quality bonds in general act as a shock absorber.
Bottom line for you: The investors who already own long bonds don’t just protect their portfolio — those bonds make money that offsets the stock losses. It’s the classic 60/40 portfolio working perfectly.
How This Changes Your Actual Decisions?
In all three scenarios, the signal comes from the bond market first.
Watch the TIPS breakeven rates we talked about earlier:
If 5- and 10-year breakevens are stable or falling → Scenario 1 or 3 is more likely.
If breakevens are rising fast → markets are pricing in Scenario 2 (sticky inflation + higher yields).
The beauty of this framework is it stops you from “chasing the wrong things.”
Instead of asking “what should I buy today?”, you ask:
“Which of these three worlds is the bond market telling me is most probable right now?”
That single shift in thinking keeps you in the right sectors (value vs growth, bonds vs stocks, commodities vs tech) instead of getting whipsawed.
The reason this matters for your specific holdings comes down to relationships that the bond market controls, whether you’re paying attention or not.
Growth stocks are long-duration assets in the same mathematical sense that a 30-year bond is. Most of their value is in cash flows that are years or decades away, which means rising discount rates compress that value dramatically — in present-value terms, a company growing at 30% per year is worth roughly half as much when the discount rate moves from 2% to 5%. That’s not an opinion about the business. It’s arithmetic. The bond market’s direction matters more for your growth positions than any quarterly earnings report.
Dividend stocks have a different problem: they compete directly with Treasuries for the same capital. When a 10-year bond yields 4.5% with zero risk, a dividend stock yielding 3% needs to offer compelling growth expectations just to justify the premium. When that yield spread compresses too far, institutional capital rotates to bonds — not as a market call, but as a mechanical response to relative value.
Watching that spread is more informative than watching the stock price.
Takeaway: Bonds Rule Everything
I spent years thinking investing was about picking the right stocks. It’s mostly about understanding how money flows between assets based on the risk-free rate set in the Treasury market.
Exceptional stock-picking might add 3–5% of edge if you’re genuinely good at it.
Understanding interest rate regimes and the correlation shifts they drive can help you avoid 20–40% drawdowns by recognizing when the operating system itself is changing.
Once you start reading the bond market, you realize it’s been broadcasting information the whole time that stocks can’t:
What inflation will actually do next
TIPS breakeven rates — the spread between nominal Treasury yields and inflation-protected TIPS — reflect the bond market’s collective inflation forecast across 5- and 10-year horizons. No economist’s projection, no Fed statement, gets updated as continuously or carries as much money behind it.Whether a recession is forming
The 2-year/10-year yield curve has inverted before every major recession since the 1970s. It isn’t a media prediction. It’s the aggregate bet of the world’s largest macro capital pools — institutional investors who have real money on whether short-term rates will eventually fall as growth disappoints.Whether stocks are expensive or cheap
The earnings yield on equities — 1 divided by the PE ratio — compared against the Treasury yield tells you whether you’re being paid adequately to take equity risk. At CAPE 37× and Treasury yields at 4.4%, the equity risk premium is currently negative. You earn more, with certainty, holding the risk-free asset.How leveraged companies are really doing
High-yield bond spreads price in default risk before equity markets adjust. When junk bonds start selling off, it means credit conditions are tightening for the companies most sensitive to rate changes — often months before that stress appears in earnings.Where the dollar is going
Interest rate differentials between US Treasuries and foreign government bonds drive currency flows. When US yields rise relative to European or Japanese bonds, capital moves to America, the dollar strengthens, and commodity prices in dollar terms fall. For anyone holding energy equities or precious metals, this is the mechanism that connects Fed policy to your positions.
Most investors are watching stock tickers.
Institutional capital — the kind that actually moves markets — is watching the 2-year yield, the TIPS breakevens, the credit spread, and the Treasury auction results.
That gap between what retail investors monitor and what professional capital monitors is where edge lives.
The bond market is trying to tell you something right now.
The only question is whether you’ll listen before the equity market confirms what bonds already know.
Sincerely,
The Pareto Investor
Want to see my latest portfolios move? I regularly publish detailed portfolio updates and market analysis — showing how I apply the 80/20 rule to real capital.
TLT 0.00%↑ IEF 0.00%↑ SHY 0.00%↑ BND 0.00%↑ AGG 0.00%↑ TIP 0.00%↑ LQD 0.00%↑ HYG 0.00%↑ EDV 0.00%↑ GOVT 0.00%↑
Related Reading
US Treasury Market: Imminent Collapse? — earlier bond-market stress framework
The Treasury Collapse Is Here 2026 — Protect Your Wealth Before It's Too Late — portfolio-defense plan for a Treasury stress regime
The Coming Debt Crisis — fiscal spiral that sits under bond-market dominance
Pareto Permanent Portfolio — 2026 — all-weather book where bonds still matter
Pareto Portfolios Update — Sept 2026 — allocation notes when Treasury blinked
"Most people chase stocks. Pros watch bonds. And right now, the bond market is flashing red signals… Every investor should pay attention." — Wise words & great article.
To me, the increasingly likely global energy shock due to the ongoing Iran conflict will worsen inflation in a substantial way, drive up 10-year interest rates, and have a predictable outcome for the stock market. The market (bond and equity) still seems to expect a quick resolution of the conflict. Once (or if) that changes, things should get interesting very fast.
I’m not saying this is certain, but the probability of a stock market downturn is increasing by the hour.
Great article! I just wrote about how many investors treat bonds as a passive allocation when there are indeed many dynamics that need to be considered. I appreciate your comprehensive overview.